Calculating the true cost of ZLD and industrial solar is now a core ROI decision for every Indian manufacturer under global supply-chain pressure.
Global buyers demand lower Scope 3 emissions, freshwater costs keep rising, and industrial power tariffs remain high.
Against that backdrop, industrial solar generally reaches simple payback in about 3.5–7 years, depending on state tariffs, system size, load profile, financing, and tax position, while ZLD's payback runs on a different, water-and-compliance-driven logic. The question for plant owners and CFOs is no longer whether these investments are "green," but whether the cash-flow numbers justify the capital.
For export-oriented manufacturers, MNC compliance audits increasingly extend beyond CPCB compliance into supplier-level Scope 3 emissions, energy sourcing, and decarbonization data.
That changes the financial question for a factory owner. Environmental spending is no longer limited to avoiding regulatory action. It can affect customer retention, export access, financing, and future operating costs.
Net Zero Tracker estimates that 68 percent of India's USD 446 billion exports, supporting 32 million jobs, go to net-zero-committed countries. It also estimates that 7.5 million Indian jobs depend on exports to markets with active CBAMs, while another 4.7 million jobs are connected to countries considering similar measures.
This analysis identifies 231 major multinationals across India's 10 largest export markets that already have Scope 3 coverage. The exposure is particularly relevant for heavy and export-linked manufacturing.
Steel and aluminum together account for more than 20 percent of India's export value, while textiles account for 6.5 percent and support 5.5 million domestic jobs. The textile sector also faces increasing pressure from global brands with supplier Scope 3 targets.
The EU's CBAM is already moving into its definitive phase. It covers iron and steel, aluminum, cement, fertilizers, hydrogen and electricity. The UK's CBAM begins on 1 January 2027, covering aluminum, cement, fertilizer, hydrogen, and iron and steel.
For manufacturers outside these direct CBAM sectors, the risk still travels through customers. The World Economic Forum's India Scope 3 playbook specifically calls for companies to establish emission baselines, set decarbonization targets, build business cases, and engage suppliers.
This creates a business case for industrial ESG-compliant Indian manufacturing that goes beyond the CPCB environmental norms 2026 baseline. A supplier unable to quantify or reduce emissions can face a commercial problem even when its statutory pollution compliance remains intact.
The sector economics also differ. Aluminum is heavily exposed to electricity costs, with around 75–80 percent of emissions linked to electricity consumption. Steel has a much larger coal-related emissions burden.
For a CFO, that means the relevant question is not simply whether to decarbonize. It is which capital investment reduces the greatest combination of energy, water, compliance, and customer risk per rupee invested.
Also Read: PM Surya Ghar Muft Bijli Yojana 2026: Rooftop Solar Subsidy, Installation & Online Application
ZLD makes the most financial sense where freshwater costs, discharge restrictions, and production continuity risks are high enough to offset its significantly higher treatment cost.
The current vendor data shows a wide ZLD setup-cost curve because capacity, effluent chemistry, and evaporation technology can materially change the project price.
|
ZLD Capacity |
Indicative Capital Cost in India |
|
25–50 KLD |
Rs 1.5–3 crore |
|
100 KLD |
Rs 3–6 crore |
|
250 KLD |
Rs 6–15 crore |
|
500 KLD |
Rs 12–25 crore |
|
1,000 KLD / 1 MLD |
Rs 20–40 crore |
|
2 MLD and above |
Rs 40–100 crore+ |
These figures are drawn from Aksh Engineering’s 2026 indicative capital-cost ranges for a complete ZLD train covering pre-treatment, RO, evaporation, and crystallization. A separate vendor comparison places a straightforward 500 KLD ZLD plant in the Rs 6–12 crore band, with complex high-TDS applications pushing costs higher.
The difference should not be treated as a contradiction: it reflects differences in plant configuration, effluent characteristics, and project scope. That makes the Zero Liquid Discharge plant setup cost in India calculation highly site-specific.
A vendor should first examine TDS, COD, scaling tendency, recovery requirements, and the availability of steam or power. The water-return side is also equally important. ZLD systems can typically recover around 90–95 percent of wastewater as reusable water, with the balance converted into salts or solids requiring controlled disposal.
For a water-intensive factory, the CFO should therefore model ZLD against the avoided cost of freshwater procurement, wastewater disposal, production interruptions, and future compliance changes rather than comparing its Capex only with a conventional ETP.
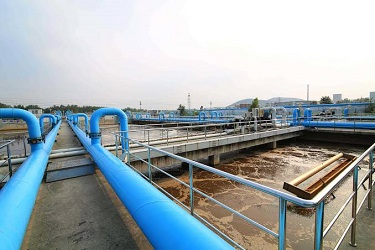
Evaporation is particularly energy-intensive. According to a blog post by Aksh Engineering, typical ZLD energy consumption runs around 80–100 kWh per cubic meter of water treated against roughly 0.5–1.5 kWh/m³ for a standard biological ETP.
That gap is the core reason ZLD carries such a steep premium over conventional treatment, and it means a site's power tariff has a direct bearing on both technology choice and long-term running cost.
Technology selection compounds this. Multiple-Effect Evaporators (MEE) carry a lower upfront cost but run on steam, tying operating cost to fuel prices.
According to the same Aksh Engineering blog post, Mechanical Vapour Recompression (MVR) systems cost more to install but run 50–60 percent lower on an ongoing basis, since they recycle the vapour's own heat instead of burning fuel, making MVR the increasingly preferred choice above 100 KLD where grid power is reliable.
Aksh Engineering also estimates Rs 3,000–8,000 per ton for salt and sludge disposal at an authorized Treatment, Storage and Disposal Facility (TSDF). The actual amount can vary with waste classification, location, and disposal arrangements, so this figure should be treated as a planning range rather than a fixed industry tariff.
This makes the ZLD operational expenditure per kiloliter highly sensitive to process design. Aksh Engineering notes that two plants with the same rated capacity can have a 2–4x difference in operating cost per kiloliter, depending largely on RO recovery and whether the evaporator uses conventional MEE or more efficient MVR technology.
Maintenance adds another layer to the cash-flow calculation. The Spans analysis of ETP neglect highlights how postponing routine compliance and maintenance work can increase the eventual cost of corrective action.
For a CFO, the relevant comparison is therefore not simply the annual AMC bill. It is the AMC cost against the potential cost of equipment failure, emergency repairs, replacement of critical components, and production disruption.
The financial model should consequently separate energy, chemicals, membrane replacement, skilled manpower, AMC, and TSDF disposal instead of treating ZLD as one annual operating-cost line.
Solar Capex maximizes long-term ownership value when the factory has capital and can use tax benefits, while PPA/RESCO preserves cash and transfers asset-performance risk to the developer.
A Capex solar project typically offers a 3.5–7 year simple-payback window, but the lower end should never be treated as universal. The variation comes from state electricity tariffs, irradiation, system size, self-consumption, financing cost, demand charges, degradation, and tax treatment.
Schedule II of the Income Tax Act 1961 provides a 40 percent accelerated depreciation rate for solar power generating systems. That can improve post-tax project economics for eligible profitable businesses.
A business in the 30 percent+ tax bracket benefits substantially from Capex because this 40 percent accelerated depreciation on solar assets, plus GST input credit on the system purchase, can reduce the effective Capex cost by 25-35 per cent.
GST treatment also needs to be modeled rather than assumed. Input tax credit on capital goods is generally available when they are used in the course or furtherance of business, subject to applicable restrictions, and this credit forms part of the same effective-cost reduction calculation for Capex owners.
In the Capex model, the customer owns the system, claims the depreciation, and captures the GST input credit. This ownership structure makes the tax and credit benefits central to the investment case, which is why tax position becomes the financial pivot when comparing Capex against Opex or RESCO alternatives.
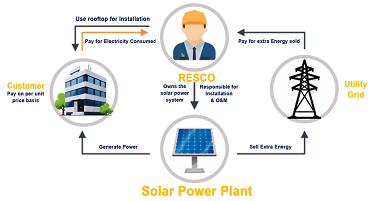 A Power Purchase Agreement (PPA) under the RESCO model removes the upfront solar Capex for the customer. The Solar Power Developer (SPD) owns, installs, operates, and maintains the system and supplies the generated electricity to the Buying Entity under a long-term contract. The customer pays only for the power consumed.
According to the SECI Standard Power Purchase Agreement for rooftop solar projects under RESCO mode:
Mercom India’s analysis of the open-access market notes that rising PPA tariffs in the second quarter of 2026 offset reductions in open-access charges in nine of the 13 states examined, resulting in higher landed costs of solar power for consumers in most cases.
Because the developer funds and owns the asset, the customer does not face a conventional Capex payback calculation. The CFO instead evaluates the year-one tariff differential versus grid power, the impact of any tariff escalation, the length of the contractual commitment, credit and payment security obligations, and the residual value or cost of any buy-out option.
The core trade-off remains one of control versus risk allocation. Under a Capex model, the manufacturer retains ownership of the asset, claims depreciation and keeps residual generation value. Under RESCO/PPA, the developer assumes performance and maintenance risk, while the customer enters a long-term electricity purchase obligation.
The choice between the RESCO/PPA model and Capex solar therefore turns on the company’s cost of capital, balance-sheet preferences and willingness to commit to a multi-year energy contract.
Also Read: From Compliance to Value: Rethinking ESG in FMCG Operations
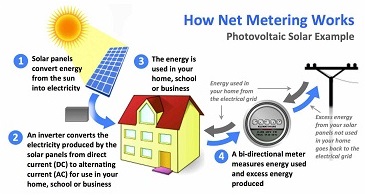 Solar project economics vary sharply across states because cross-subsidy surcharge (CSS), banking rules, net-metering limits, and DISCOM approval timelines directly shape the landed cost of renewable power.
These differences can materially change project returns. A rooftop system that works well on direct self-consumption may deliver a weaker return once open-access charges, banking restrictions, and delayed approvals are factored in.
Manufacturers must therefore model state-specific charges and timelines rather than relying on national averages when evaluating open-access or net-metered solar.
The strongest green-factory business case comes from stacking financing, tax, and carbon instruments against the same project rather than calculating each benefit separately.
A manufacturer can evaluate green bonds or green debt for larger projects, sustainability-linked loans where borrowing costs are connected to measurable sustainability targets, and transition finance for harder-to-abate industrial assets.
Sustainability-linked structures can include interest-rate adjustments when agreed performance targets are met or missed. For MSMEs, SIDBI's green-finance portfolio includes the Green Finance Scheme and End-to-End Energy Efficiency Finance Scheme (4E).
SIDBI reports that these products cover areas including energy efficiency and renewable energy. Its newer MSE-GIFT scheme is designed to improve access to institutional finance at concessional rates for clean and green technologies.
Carbon credits add another potential value stream, but CFOs should not book uncertain future credit revenue as guaranteed project cash flow. Credits require appropriate measurement, verification, and eligibility.
The financial model should therefore run a base case without carbon revenue and a separate upside case for verified monetization. The same discipline applies to subsidies and interest-rate benefits. The correct model is:
Project return = energy savings + water savings + avoided compliance/disposal costs + verified incentives/credits − Capex financing cost − O&M − regulatory charges.
This approach makes Green financing for Indian MSMEs, the SIDBI energy efficiency loan scheme, and Carbon credit monetization in India part of one capital-allocation decision rather than disconnected sustainability initiatives.
Also Read: How India's Government Policies Support Chemical Manufacturing (2026 Strategy Guide)
|
Category |
ZLD (Zero Liquid Discharge) |
Solar – Capex (You Own It) |
Solar – PPA/RESCO (Developer Owns It) |
|
Upfront cost |
Rs 1.5 cr and up (scales with plant size and effluent load) |
Rs 50 lakh – Rs 2.4 cr for a 500 kW system (varies by vendor/scope) |
Rs 0 |
|
Yearly running cost |
High — Rs 35 lakh+/yr even for a small plant (energy-heavy process) |
Not clearly published — get a direct AMC quote |
Rs 0 to you (baked into the per-unit tariff you pay) |
|
Who takes the risk |
You, fully |
You (you own the asset, but also the upkeep) |
Developer (you just pay for power used) |
|
Payback/Term |
3–5 years (via water savings + avoided disposal cost) |
4–7 years |
No payback — it's a 15–25 year electricity contract |
|
Best for |
Any factory legally required to have it — this isn't optional |
Cash-rich companies in a high tax bracket (can use depreciation benefit) |
Cash-constrained companies wanting savings with zero investment |
|
Main hurdle |
Pollution board approvals + safe disposal of leftover salt/sludge |
Getting the local DISCOM to approve your grid connection |
Locking in a fair long-term contract (rate, escalation, exit terms) |
The capital-allocation conclusion is straightforward. ZLD should be judged as a water-security and compliance-risk investment with a heavy operating-cost burden. Solar should be judged as an energy-price hedge whose return depends heavily on state regulation and ownership structure.
For a CFO, neither technology deserves approval simply because it is labeled "green." The right project is the one whose cash-flow savings, avoided risks, financing benefits, and regulatory resilience outweigh its full lifetime cost.
For Indian manufacturers, the green factory ROI equation depends on the plant’s specific water, energy, compliance and financing profile. ZLD can strengthen water security and regulatory resilience but carries high operating costs, while industrial solar can reduce power costs and provide a longer-term hedge against tariff increases.
The strongest investment case comes from evaluating lifetime cash flows, not upfront Capex alone. CFOs should factor in avoided water and energy costs, compliance risks, financing benefits, tax advantages, state-level charges, and potential carbon revenue. The goal is simple: choose the project that delivers measurable financial value while improving the factory’s long-term resilience.
The cost figures, DISCOM timelines, and state-wise policy comparisons in this article are based on data available at the time of publication. Solar policies, open-access charges, cross-subsidy surcharges, and ZLD compliance norms vary by state and are revised periodically by regulators and DISCOMs. Manufacturers should verify current tariff orders, net-metering limits, and incentive structures with their respective state electricity boards before finalizing any investment decision.
Fathimanoud is a Correspondent with experience covering the manufacturing and pharmaceutical sectors. She has written several articles on the pharma and manufacturing industries, with a particular focus on pharmaceutical developments and industry updates.
.jpg "Textile Special")





We use cookies to ensure you get the best experience on our website. Read more...