Ask a retailer what’s wrong with their inventory. Nine times out of ten, the answer is “forecasting.”
Now ask how many units of their best seller are in the back room right now. Watch them reach for a phone.
That pause tells you more than any forecast. The stores pulling ahead lately aren’t running cleverer demand models than everyone else. They just have stock numbers they can believe, and that turns out to be rarer than it should be.
Why Stock Has Become A Boardroom Question
Inventory used to belong to operations. A buyer ordered, somebody counted before year-end, finance looked at the total once and moved on.
IHL Group’s 2025 inventory distortion research puts the global cost of out-of-stocks and overstocks at about $1.77 trillion (roughly 6.5% of retail sales worldwide). Around $1.2 trillion of it is empty shelves. The remaining $572 billion is excess stock that eventually gets marked down or binned.
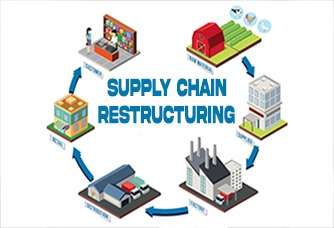
Freight and fuel costs still won’t sit still, so plenty of companies are holding extra safety stock on purpose. The Industry Outlook’s supply chain restructuring playbook makes a fair case for moving from Just-in-Time to Just-in-Case. Fine. But put a bigger buffer on top of bad records and what you get is more of the wrong product, held longer, tying up more cash.
It tends to go like this. A store keeps running out of popular items, buys a forecasting tool, and six months on the suggested orders still look odd. Staff stops using them. The software gets blamed.
Usually unfairly. Say the system shows 14 bottles of a gin and the shelf holds 9. Every reorder now starts five bottles off. The trade term is phantom inventory, and it’s nasty precisely because the system “sees” stock that isn’t there, so the reorder you needed never fires.
Chain Store Age’s coverage of the IHL findings notes that fewer than a quarter of retailers have actually rolled out AI or machine learning where inventory distortion hurts most. Money is one reason. Messy records are, I’d bet, the bigger one.
Outlook interview on why contextual industrial data matters for AI-ready operations gets into it from the plant floor.
Think of the fix as a ladder. Four rungs. Everybody wants to start on the top one, and it rarely goes well, because each lower rung is what holds the next one up.
Rung One: Control What Comes Through The Door
Owners usually blame shoplifters first. I’d go stand by the delivery door instead.
Distributors short-ship. A driver swaps in a substitute without saying much. A smashed case gets noted on the day, then the credit quietly never appears. None of this needs a villain - warehouses slip up, and drivers have a dozen more stops before lunch. Still, the moment you sign that slip, you’ve agreed everything arrived.
Write shortages on the paperwork while the driver’s still there. Chase the credit until you see it. Boring? Very. Here’s the maths, though. A store taking about 40 cases a week that misses one $180 case every other week loses around $4,680 a year, and that’s before small price bumps on single items creep through unnoticed.
Rung Two: Make The System Match The Shelf
Once deliveries are under control, the question becomes simple. Are your on-hand numbers true? A yearly stocktake can’t answer that. When it turns up a gap, the gap might be from March or from September, and nobody knows which.
Cycle counting can. Count a small section every week, and hit the risky items more often. Liquor shops are a handy model here: pricey bottles, regulated product, and theft that only shows when a count comes up short weeks later.
A practical SanteHQ guide on inventory optimization for liquor stores sorts losses into customer theft, employee theft, and vendor delivery errors, and recommends weekly spot counts on the most-stolen products rather than waiting for a full count. Honestly, a lot of non-liquor retailers should steal that habit.
A test before you climb: grab 50 SKUs at random, count them by hand, compare with the system. More than five wrong? Stay put. Automating on top of those numbers just produces the same mistakes faster.
Rung Three: Stop Treating Every SKU The Same
Here’s where optimization actually starts meaning something. Some products earn a deep buffer. Some barely earn their shelf. Most stores still handle them identically.
Three buckets work for me:
A pharmacy fills those buckets differently from a hardware store, and a neighbourhood kirana shop differently again. That’s expected. What counts is deciding in advance which mistakes you’re willing to make.
Rung Four: Forecast, Then Automate
Now, finally, forecasting pays for itself. With tight receiving, honest counts, and tiered products, a demand model has something real to chew on. Festival weeks and seasonal spikes stop being surprises.
Coruzant’s analysis of the role of automation in the future of distribution describes inventory systems that track stock movement as it happens and start replenishment when something dips below a set level. The Industry Outlook has also covered how AI-driven modernization is helping manufacturers scale faster.
Same idea in retail: the tech earns its keep when the basics underneath are already sorted. Keep a human override, though. The local buyer who knows the town fair moved to a different weekend will beat a model trained on last year’s dates every time.
Picture a hypothetical independent liquor store. Roughly $1.4 million a year, around 3,000 SKUs, a point-of-sale system, one big annual count, and an owner with a nagging feeling that stuff is walking.
Step one is a second person on every delivery. Within a month, that catches two short shipments and a credit the distributor forgot.
Then come weekly counts on the 40 most-stolen bottles. One premium bourbon keeps coming up short, so it goes behind the counter, and the losses stop. A retail-specific system like SanteHQ, which ties counts and adjustments to individual employee logins, helps pin down when a variance actually started.
Next, the wine wall loses about a fifth of its slowest sellers, freeing cash and space. Forecasting shows up last, pointed at the holiday rush.
Week One: Audit Receiving
Watch three deliveries start to finish. Note every point where someone assumes a count happened instead of checking.
Weeks Two And Three: Run An Accuracy Test
Do the 50-SKU test. Then start weekly cycle counts on your riskiest items.
Week Four: Tier Your Range
Sort products into protect, watch, and trim. Give each group its own reorder points.
Square, Lightspeed and Shopify POS all handle standard inventory tracking well, and they suit plenty of retailers selling across many categories. If alcohol is the core of your business, specialist tools such as Korona POS, Bottle POS and SanteHQ go further on age checks, case-versus-bottle pricing and distributor invoices.
Whatever’s on your shortlist, put a few blunt questions to the vendor. Is every stock adjustment logged against a named user? Can it read a supplier invoice, or does somebody retype it? Can staff count on a phone while walking the aisles? Will it show variance by SKU and by shift?
Then ask for a variance report from a real store, not a demo deck. How fast they produce one says plenty.
Inventory optimization has become a competitive advantage, and not because the tools are shiny and new. It’s because getting stock wrong now costs too much to shrug off. The retailers who’ll come out ahead aren’t automatically the ones with the biggest AI budget.
Get their counts honest, and treat products differently before letting any forecast make the call. So start at the delivery door. Less exciting than a demand model, sure. For most stores, though, that’s where the money’s leaking out.







We use cookies to ensure you get the best experience on our website. Read more...